
InsightsPulse Admin Panel Documentation
This guide helps you understand and manage the InsightsPulse admin portal – from user onboarding and organization setup to report publishing, allotment, billing and account management.
1. Overview
InsightsPulse is a white-label report delivery platform that allows you to host and share Power BI / Tableau / other BI reports with your end customers without exposing your original BI tool or increasing license costs.
- Central admin portal to manage organizations, workspaces and users.
- Role-based access to dashboards and reports.
- Configurable subscription plans and billing.
- Secure embedding and access control for reports.
2. Getting Started
To begin managing your report delivery platform, you first need to register your organization account and log in to the admin panel. Follow these step-by-step instructions:
Step 1: Account Registration
If you are a new customer and do not have an account yet, you must register your organization:
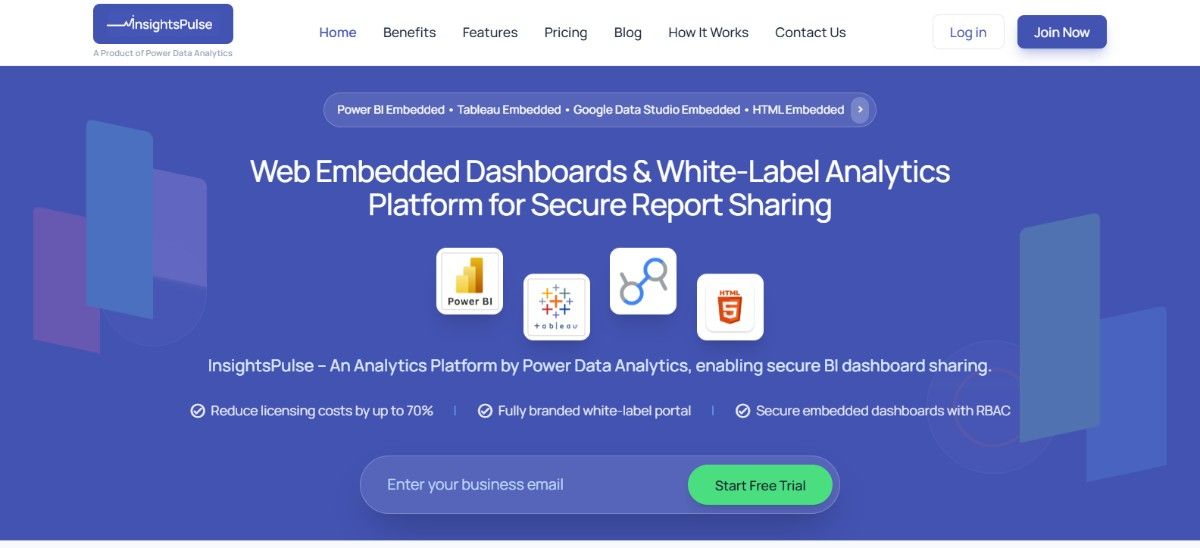
- Navigate to the homepage at https://insightspulse.in/.
- Click the Join Now button in the top navigation bar to go to the Registration page.
- Fill in all required fields in the registration form, including:
- Organization Name: The name of your enterprise or business client.
- Full Name: The primary administrator's name.
- Email ID: This will be your primary admin username for login.
- Mobile Number: Contact number for account verification.
- Password: Choose a secure password.
- Accept the Terms & Conditions and click Submit to create your organization portal.
Step 2: Admin Login
Once registration is complete, or if you already have an existing administrator account, follow these steps to log in:
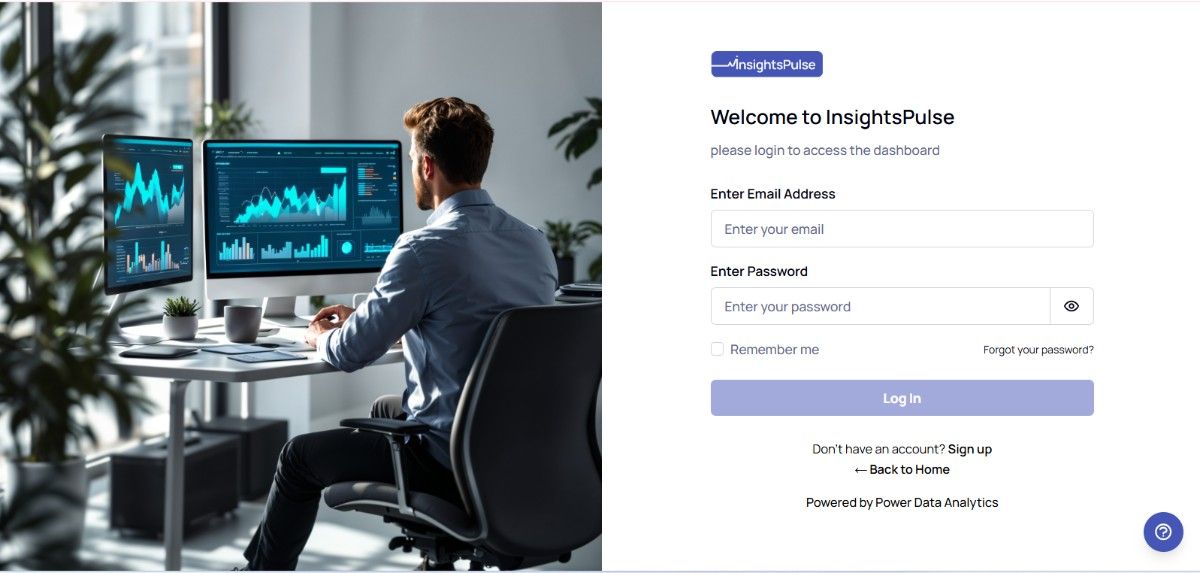
- Open your browser and navigate to the Login page (e.g.,
https://insightspulse.in/Loginor your custom admin URL). - Enter your registered Email ID and Password in the fields provided.
- Click the Log In button.
- Upon successful verification, you will be redirected automatically to the Admin Dashboard.
Step 3: Initial Onboarding Workflow
After logging in for the first time, perform these setup steps to configure your white-label portal:
- Complete your Profile Settings and set up organization-wide preferences.
- Create your first customer Organization (if hosting multiple client portals).
- Create a Workspace to organize reports.
- Publish/Add reports under the Report List module.
- Invite users and use Report Allotment to assign report access.
3. Dashboard Overview
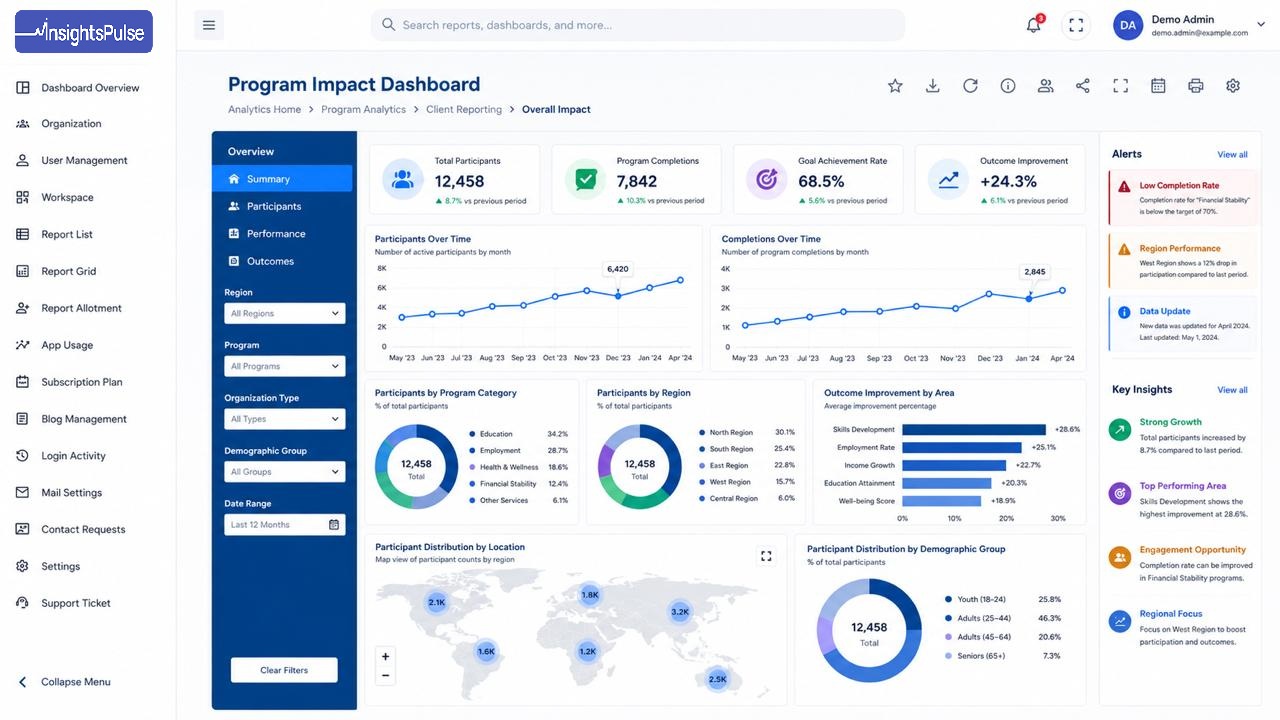
The Admin Dashboard is the central command center of the InsightsPulse portal. It provides real-time tracking of platform usage, security metrics, and direct links to all administration modules.
Key Metrics Widgets
At the top of the dashboard page, you will see three high-level summary cards showing platform activity:
- Total Users: Shows the total number of users registered on the platform (e.g., 25 users) along with a green sub-label indicating the number of users registered today (e.g., +1 users added today).
- Total Reports: Shows the total number of active/allotted BI reports (e.g., 30 reports) and the number of new reports added today.
- Login Attempts: Displays security audits showing successful logins (e.g., 10 Success) and failed attempts (e.g., 3 Failed) in real-time.
Recent System Activity Audit
This widget tracks all actions performed on the platform chronologically:
- View real-time event logs detailing who accessed which report (e.g., '[email protected]' viewed report 'FaceFit Sales Accruals 2024-25').
- Track management actions (e.g., New user created by [email protected]).
- Check precise event timestamps (e.g., 25 May 2026 02:34 AM).
- Click the View All button on the top right of this widget to go to the full Login Activity / System Audit Logs.
Top Viewed Reports Tracking
Displays the most active reports by view count to analyze user engagement:
- Review the ranked list of reports with their corresponding view count (e.g., Opendental Appointment - 371 views, FaceFit Sales Accruals 2024-25 - 226 views).
- Use these insights to determine which dashboards are critical to your client's business operations.
- Click View All to navigate to the comprehensive report analytics page.
Typical Actions and Steps:
- Access the Dashboard: After logging in, you will be redirected to
/Admin/Dashboard. - Quick Report Search: Use the top search bar (Search reports...) to quickly find and launch any report.
- System Alerts Check: Check the header icons for notifications (bell icon) and toggle full-screen mode for presentations using the layout icon.
- Profile Management: View the logged-in administrator's profile role (e.g., Super Admin) and email (e.g., [email protected]) on the far right.
4. Organization
Organizations represent the distinct customer companies, client entities, or internal departments that use the portal. The Organization Details module lets you manage client profiles, assign BI report engines (Power BI, Tableau), configure feature access, and set up Azure AD credentials for secure report embedding.
1. Organization Details (List View)
When you click on the Organization link from the sidebar menu, you will land on the Organization Details page:
- Search & Filter: Use the top search bar (Search by name or email...) to search organizations. You can filter by Status (All, Active, Inactive) and reset search filters via the Clear All link.
- Organization Directory Table: Displays:
- Organization Name & Email: Displays the organization logo and contact details (e.g., Keti Testing - [email protected]).
- Power BI Credentials: Lists Azure Directory (Tenant) ID and Application (Client) ID. Click the Eye icon to toggle credential visibility.
- Tableau Credentials: Displays the client ID and user email linked to Tableau reports.
- Username & Status: Displays the username used for authentication (e.g., Keti Testing) and an Active/Inactive status badge.
- Created On: Date of onboarding.
- Actions: Click the Pencil Icon to edit organization details or the Trash Icon to delete. Warning: Deleting an organization will cascade and remove all associated data. A confirmation prompt will appear before deletion.
- Export Options: Click the Export button to download a CSV/Excel spreadsheet containing the organization list.
2. Adding a New Organization (Step-by-Step)
To onboard a new organization, click the Add New Organization button in the top right corner of the Organization Details list. Fill in the form fields across the three designated panels:
- General Information:
- Organization Name: Enter the official business name of the client.
- Official Email: Enter the primary contact email address.
- Organization Username: Define a unique admin username for the organization.
- Organization Phone No: Enter contact phone details.
- Organization Address Details: Enter the physical billing address.
- Upload Organization Logo: Drag-and-drop or select an image file to white-label this client's portal headers.
- Allowed Organization Report Access & Permissions:
- Report Access: Select the BI engines the organization can access (check boxes for PowerBI, Tableau, HTML, or Google Data Studio).
- Feature Permissions: Enable specific platform actions like Report Subscription, Report UI Feature, or Report Download (to export PDF/Excel).
- Power BI Settings (If PowerBI access is selected):
- Directory (Tenant) Id: Paste the 36-character tenant ID from Azure Active Directory.
- Application (Client) Id: Paste the client application ID linked to your Power BI embedding app.
- Application Client Secret: Input the secure application client secret token.
- Tableau Settings (If Tableau access is selected):
- Tableau User Email: Enter the user email associated with the Tableau account (e.g., https://prod.tableau.com/).
- Personal Secret Id: The name of the token generated in Tableau.
- Personal Client Id: The Client Id (e.g., xxxxxxxx-xxxx-xxxx-xxxx-xxxxxxxxxxxx).
- Tableau Secret: Input the secure Tableau secret.
- Save Organization: Review all inputs and click the Save Organization button at the bottom right to complete onboarding, or click Cancel to discard.
5. User Management
The User Management module allows administrators to add, configure, and monitor portal accounts. You can manage internal administrators, client organization administrators, and end-users (viewers), monitor their login history, and configure Single Sign-On (SSO) credentials.
1. User Management Directory (List View)
Upon navigating to the User Management page, you will see a detailed user log and administration dashboard:
- Search & Filter Options:
- Use the search box (Search by name or email...) to quickly find a user.
- Filter users by Organization, Status, or Role using the respective dropdown menus.
- Click the Last login filter to sort users by their most recent activity, or click Clear All to reset filters.
- Top Action Buttons:
- + Add New User: Click to manually onboard a user or set up SSO.
- Export: Download the active user list as a CSV/Excel spreadsheet.
- Broadcast Alert: Send a global notification banner to all active user portals instantly. Click the button to open the broadcast modal, enter your alert message, select the target audience, and confirm to send the alert immediately.
- User Directory Table Columns:
- User Details: Displays the user's avatar image, full name, registered email address, and a masked password (e.g., ######) with an eye icon to toggle visibility.
- Organization Name: The client organization to which the user is assigned.
- Role: The system access level (e.g., Report Viewer, Organization Admin).
- Status: Displays an Active/Inactive status badge, along with the precise timestamp of their last login session.
- Created On: The registration date of the account.
- Actions: Pencil and Trash icons to Edit or Delete user accounts. Warning: A confirmation prompt will appear before deletion.
2. Creating a New User (Step-by-Step)
Click the Add New User button to open the creation form. You can onboard users in three ways:
- Method A: Manually Add a New User (Admin Created)
- Full Name: Enter the user's complete name (as shown in the console header).
- Email Address: Enter their email (used as their login identifier).
- Role/Permissions: Select their permission tier (e.g., Administrator, Manager, Report Viewer).
- Select Organization: Select the organization they belong to.
- Note: A temporary password will be automatically generated and sent to the user. They will be prompted to change it upon their first login.
- Click Add User to save.
- Method B: Single Sign-On (SSO) Auto-Provision
- If configured, users from whitelisted domains (e.g., yourcompany.com) can sign in immediately using their organization credentials without manual account creation.
- Automatic Activation: When enabled, new users logging in from whitelisted domains will have their accounts automatically created and activated on their first login attempt.
- To configure domains, identity provider (IdP) metadata, or client IDs, click the Manage SSO Settings link.
- Method C: Self Sign-Up
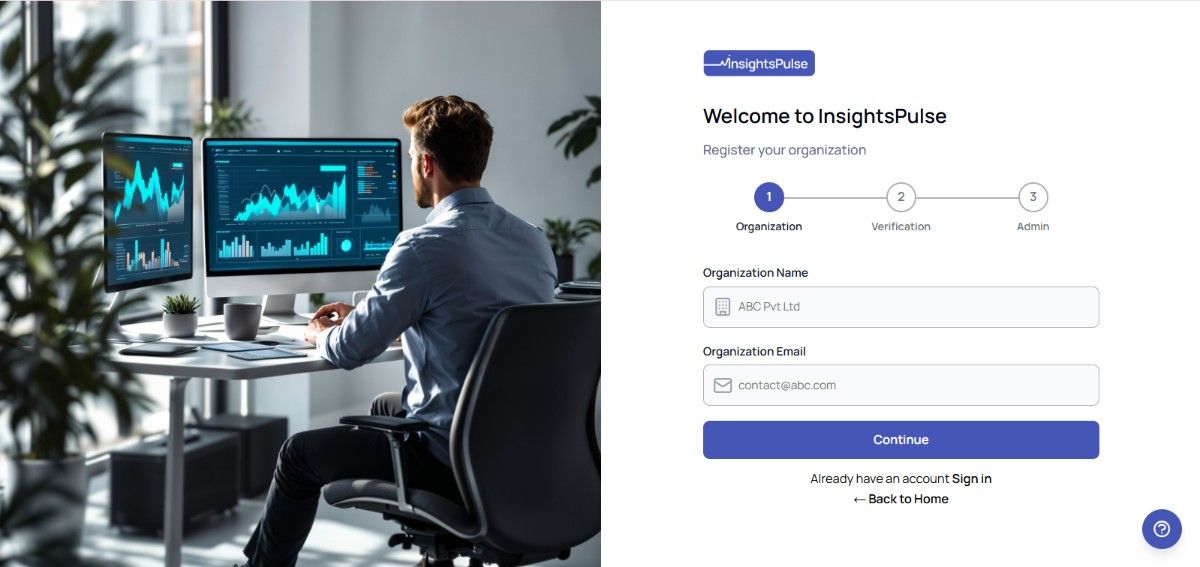
- Organization admins and viewers can self-register using the "Sign up" link on the login page.
- They will need to fill in their details and will be automatically associated with their organization.
6. Workspace
Workspaces act as secure logical containers mapped to specific client organizations to host reports. Within each workspace, you can define categories (e.g., “Finance”, “Sales”, “HR”) to keep reports organized and structured.
1. Workspace Management
The workspace configuration panel is divided into workspace settings (on the left) and category settings (on the right):
- Add Workspace Form:
- Workspace Name: Enter the name of the workspace (e.g., Driotech.io).
- Select Organization: Select the organization that owns this workspace.
- Workspace ID: Enter the unique identifier for the workspace (e.g., your Power BI Workspace GUID).
- Click Add Workspace to save.
- Workspace List:
- Displays serial numbers, workspace names mapped to their respective organizations, masked Workspace IDs (click the eye icon to view), active status badges, and edit/delete actions.
2. Category Management
Categories group reports inside workspaces for clean structure.
- Add Category: Enter a category name (e.g., Test Category) in the right panel input and click Add Category.
- Categories Directory: Review the active categories table on the right side, showing all registered categories and their edit (pencil) and delete (trash) action buttons.
7. Report List
The Report List module manages the collection of BI reports, web links, and iframe embeddings integrated into the portal. You can view all registered reports, search/filter through them, and add new ones with custom thumbnails.
1. Report List (Directory View)
When you open the Report List from the sidebar menu, you will see the All Reports dashboard:
- Search & Filter Options:
- Report Name: Search dynamically via the Search by report name... text input.
- Category / Workspace / Report Type: Filter the listing table using these dropdown filters to isolate specific report sets.
- Top Action Buttons:
- + Add New Report: Manually register a new report definition.
- Export: Download the list of active reports as a CSV/Excel spreadsheet.
- Reports Table Columns:
- Report Name: Displays a thumbnail icon, the title of the report (e.g., Workforce Dashboard), and the green category badge (e.g., Marketing).
- Organization & Workspace: Displays the target organization name and its linked workspace name with GUID.
- Report Type: Identifies the reporting engine used (e.g., PowerBI, Tableau, HTML, Google Data Studio).
- Created On: The date the report was added.
- Actions: Click the Eye Icon to preview the report live, the Pencil Icon to edit, or the Trash Icon to delete. Warning: A confirmation prompt will appear before deletion.
2. Adding a New Report (Step-by-Step)
To add a new report, click the Add New Report button. Complete the details in the Add New Report form:
- General Metadata (Left Panel):
- Report Title: Enter a name (e.g., Quarterly Sales Performance).
- Description: Provide a brief description of the report's purpose.
- Report Type & Category: Select the BI engine and select the parent category from the dropdowns.
- Organization & Workspace: Select the target organization and select the workspace hosting the report.
- PowerBI Report Id / Tableau Embed URL: Input the secure report ID or paste the embed URL according to the chosen Report Type.
- Upload Report Cover (Right Panel):
- Click Choose an image to upload a thumbnail preview that will appear on the user's report card.
- Save Changes: Click Save Report at the bottom right to publish the report, or click Cancel to discard changes.
8. Report Grid
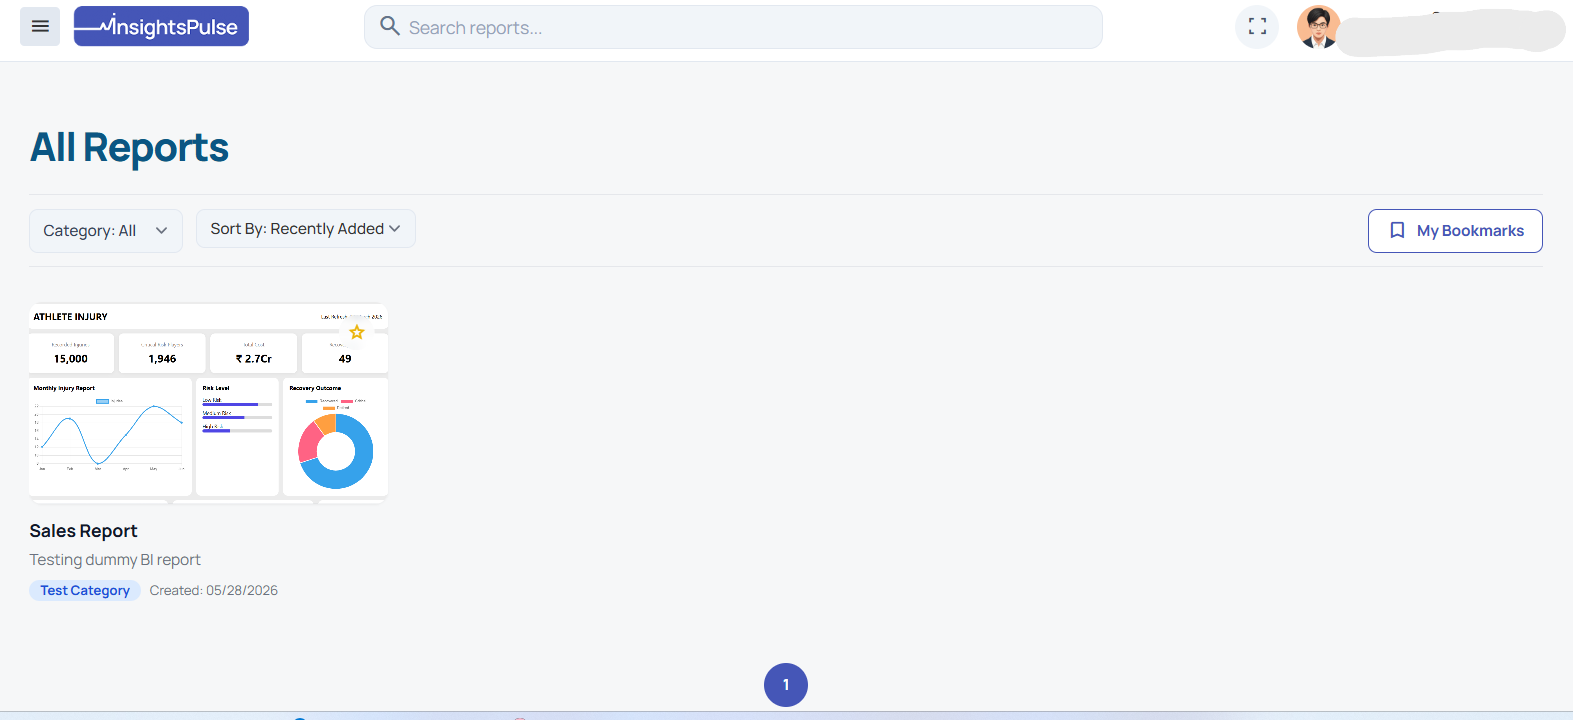
The Report Grid module provides a visual gallery-style overview of all active reports. It allows administrators and end-users to browse reports through cards, filter them by category, mark favorites, and launch reports instantly.
1. Report Grid Dashboard
When you select the Report Grid from the navigation menu, you are presented with the catalog page:
- Category Selector: Filter cards by selecting a specific folder or category (e.g. Marketing) from the Category dropdown.
- Sorting Options: Sort the report list using the Sort By dropdown (e.g., sorting by Recently Added or alphabetically).
- My Bookmarks: Click the My Bookmarks button to display only the reports you have starred.
2. Interactive Report Cards
Each card in the gallery represents a registered report and displays:
- Visual Thumbnail: The custom uploaded report preview image.
- Star Icon (Favorite Toggle): Click the star icon on the top-right corner of the card to bookmark/unbookmark reports for quick access.
- Text Details: The report's title and its descriptive subtitle (e.g., Investment analysis).
- Category & Date Badges: Shows the category identifier (e.g., Marketing in blue) and the creation date (e.g., Created: 05/18/2026).
- Report Execution: Click on any report card to instantly launch and load the embedded interactive report dashboard.
9. Report Allotment
The Report Allotment module manages user access rights for all embedded reports. It allows administrators to select organizations, view all reports hosted in a workspace, and use a slide-out drawer to selectively assign or revoke report access for specific users.
1. Report Allotment Filter & Directory
When you open the Report Allotment dashboard, you will use the primary selection and table layout:
- Selection Filters:
- Organization & Workspace (Required): Select the target client organization and workspace from the dropdown menus to retrieve the report list.
- Search & Type Filters: Narrow down reports by typing in the search box (Search by report name...) or selecting a report type from the Report Type dropdown.
- Report Directory Columns: Displays:
- Report Name: The display title of the report.
- Report Type: The embedding type (e.g., PowerBI, Tableau, etc.).
- Category: Mapped folder or group category.
- Creation Date: Date when the report was added.
- Access By: Lists the usernames or icons of users who currently have viewing permissions.
- Footer Controls: Manage page size using the Items per page dropdown and navigate pages via the pagination arrows.
2. Managing User Access (Right Slide Drawer)
To edit access settings, click on any report row in the table to open the slide-out drawer on the right side:
- Report Metadata Card: Review the read-only properties of the report (displays Report Name, Report ID, and Description).
- Manage Access Panel: Displays a list of all registered users in the selected organization.
- Check a user's checkbox to grant access to this report.
- Uncheck a user's checkbox to instantly revoke access to this report.
- Click the Close (X) button at the top-right of the drawer to collapse the panel and save changes. Note: Closing the drawer commits your changes immediately.
10. App Usage
The App Usage Reports dashboard provides real-time insights into system utilization, report consumption, and user logins. Administrators can analyze views, monitor activity spikes, and audit individual report utilization.
1. Metric Cards & Filters
Configure the dashboard view using range selectors and monitor KPIs:
- Time Range Filtering: Filter all metrics and charts using the time pills: Last 7 Days, Last 30 Days, Last 90 Days, or define a Custom Range.
- Activity History Link: Click the Activity History button in the top right corner to access raw tabular log histories.
- Core KPI Metrics:
- Total Report Views: The aggregate count of times reports were loaded.
- Unique Viewers: The number of distinct user accounts that active report viewers belong to.
- Total User Logins: Total successful authentication hits.
- Login Failures: Count of unsuccessful login attempts (useful for detecting brute force or access issues).
2. Interactive Charts & Audit Logs
Understand usage patterns through interactive visualizations and audit tables:
- Report Views Over Time (Line Graph): Visualizes report view patterns on a daily timeline, displaying total views and percentage growth trends (e.g. +32.8%).
- Most Viewed Reports (Top 5 Chart): Displays a horizontal bar chart of the top 5 most viewed reports inside the workspace.
- All Reports Activity Table: Lists all reports with granular metrics:
- Report Name: Title of the report.
- View Count: Number of times the report has been loaded.
- Unique Viewers: The count of distinct users accessing it.
- Last Accessed: Exact timestamp of the last view.
- Action Icon: Click the Eye Icon to load individual user access reports.
11. Subscription Plan
The Subscription Plan module is used to monitor organization plans, track active user billing rates, generate invoices, and assign custom pricing add-ons to individual client portals.
1. Organization Subscription Directory (List View)
When you open the Subscription Plan from the sidebar menu, you will see the Organization Subscription Plan dashboard:
- Search & Filter Options:
- Use the search box (Search by organization name or plan...) to look up organizations.
- Filter subscriptions by specific Organization, Plan Type, or active Status.
- Click Clear All to clear filters.
- Subscription Summary Table: Displays:
- Organization: The client name (e.g., Alpen Group Holdings).
- Plan Type: Displays subscription tier badges (e.g., Free Trial, Basic).
- Users & Price: Number of registered users and the per-user price tier (e.g., $8.00).
- Amount: Mapped total amount.
- Validity & Duration: Shows days validity (e.g., 31 Days), Start Date, and End Date.
- Status: Green Active or pink Expired badge indicators.
- Invoice Download: Click the Invoice button in the Action column to download/view billing statement documents.
2. Adding Subscription Plan Addons (Step-by-Step)
To add one-time charges or custom billing add-ons, click the + Add Addons button to open the **Plan Addons** panel:
- Organization & Timeline: Select the target organization, starting billing month (e.g. May), and billing year (e.g. 2026).
- Pricing & Frequency: Specify the addon pricing value in the **Price ($)** field and select the frequency type via radio buttons (**Monthly** or **One Time**).
- Addon Description: Provide a justification or detailed description of the addon in the **Details / Description** rich text area.
- Save Addon: Click + Add Addons at the bottom right to apply the addon, or click Cancel to discard.
- View Addons History: Click the Plan Addons List button at the top-right of the form to view all configured addons.
12. Blog Management
The Blog Management module allows administrators to write, format, and publish news updates, portal guides, and feature releases directly to client dashboards.
1. Blog Directory (List View)
When you open the Blog Management page, you will see the active post index:
- Search & Action: Find published blogs using the Search by Blog Title... search bar, or click + Add New Blog in the top right to start drafting.
- Blog Directory Table: Displays:
- S.No: Serial index of the posts.
- Image: Thumbnail preview of the uploaded cover art.
- Title & Short Description: Display title link and a short paragraph summary of the blog.
- Created On: Publication timestamp (e.g., Feb 26, 2026, 11:49 AM).
- Actions: Green pencil icon to edit drafts and red trash can to delete entries.
- List Pagination: Manage list sizes using the *Items per page* dropdown at the footer.
2. Creating & SEO Optimizing Blogs (Step-by-Step)
To publish a new blog post, click the + Add New Blog button and populate the Add New Blog/Updates fields:
- Content Drafting (Left Panel):
- Blog Title: Enter a title for the blog article.
- Description: Use the text area to draft and format the body of the article.
- Search Engine Optimization (SEO Metadata):
- Meta Title: Specify the title tag for search engines (shown on browser tabs).
- Meta Keywords: Input keywords related to the blog content.
- Meta Description: Write a concise summary of the article for search engine result pages.
- Blog Cover Image (Right Panel):
- Click Choose an image to upload a cover banner. The image preview will render immediately in the preview box.
- Save Post: Click the Save Blog button at the bottom right to publish, or click Cancel to discard.
13. Login Activity
The Login Activity Log acts as a comprehensive security audit trail, detailing timestamps, client IPs, browser agents, and credential outcomes for every authentication request.
1. Audit Metrics & Filters
Review high-level log statistics and filter through logs to identify security anomalies:
- Log KPI Summaries:
- Total Logins: Total login attempts made on the portal.
- Successful Logins: The total number of successful login authorizations.
- Failed Attempts: The total count of failed login attempts, crucial for tracking potential security breaches.
- Dynamic Filters:
- Date Range: Target attempts within a specified date window using the date picker.
- Filter by User: Type in a name or email address to search user logs.
- Login Status: Filter logs by status dropdown (e.g. Success or Failed).
- Click Apply to filter or Reset to restore default logs.
- Log Export: Click the Export button to download the login history as a CSV/Excel spreadsheet.
2. Login Logs Directory Columns
The audit logs list provides the following fields for each attempt:
- USER: Displays the user's avatar icon, profile name, and login email address. Failed entries from unrecognized emails display as Unknown User.
- TIMESTAMP: Shows the exact date and timestamp of the authentication attempt (e.g., May 25, 2026, 04:05 AM).
- IP ADDRESS: The IP address originating the request (e.g., 122.160.13.130).
- DEVICE: Recognizes the browser/device user agent used (e.g., Chrome).
- STATUS: Color-coded badges indicating Success (green) or Failed (red) attempts.
14. Mail Settings
The Mail Settings module is used to configure outgoing SMTP server details. This enables the platform to dispatch system notifications, onboarding credentials, password resets, and audit alerts.
Step-by-Step Mail Configuration
To configure or update the outgoing email system, populate the fields on the Mail Settings page:
- Sender & Server credentials:
- Sender Email: Enter the system's email address (e.g., [email protected]) that outgoing messages will display.
- SMTP Host: Input the hostname of your mail server provider (e.g., smtpout.secureserver.net).
- App Password: Enter the SMTP application password. Click the Eye Icon to show or hide the password characters.
- SMTP Port: Enter the communication port used by your SMTP provider (e.g., 587).
- Security & Sending Controls:
- Enable SSL: Toggle this switch to enforce secure SSL/TLS connection protocols for email delivery.
- Enable Mail Sending: A global switch to turn email operations **ON** or **OFF** across the entire application immediately.
- Save Changes: Click the Save Mail Settings button in the bottom right corner to apply the server credentials.
15. Settings
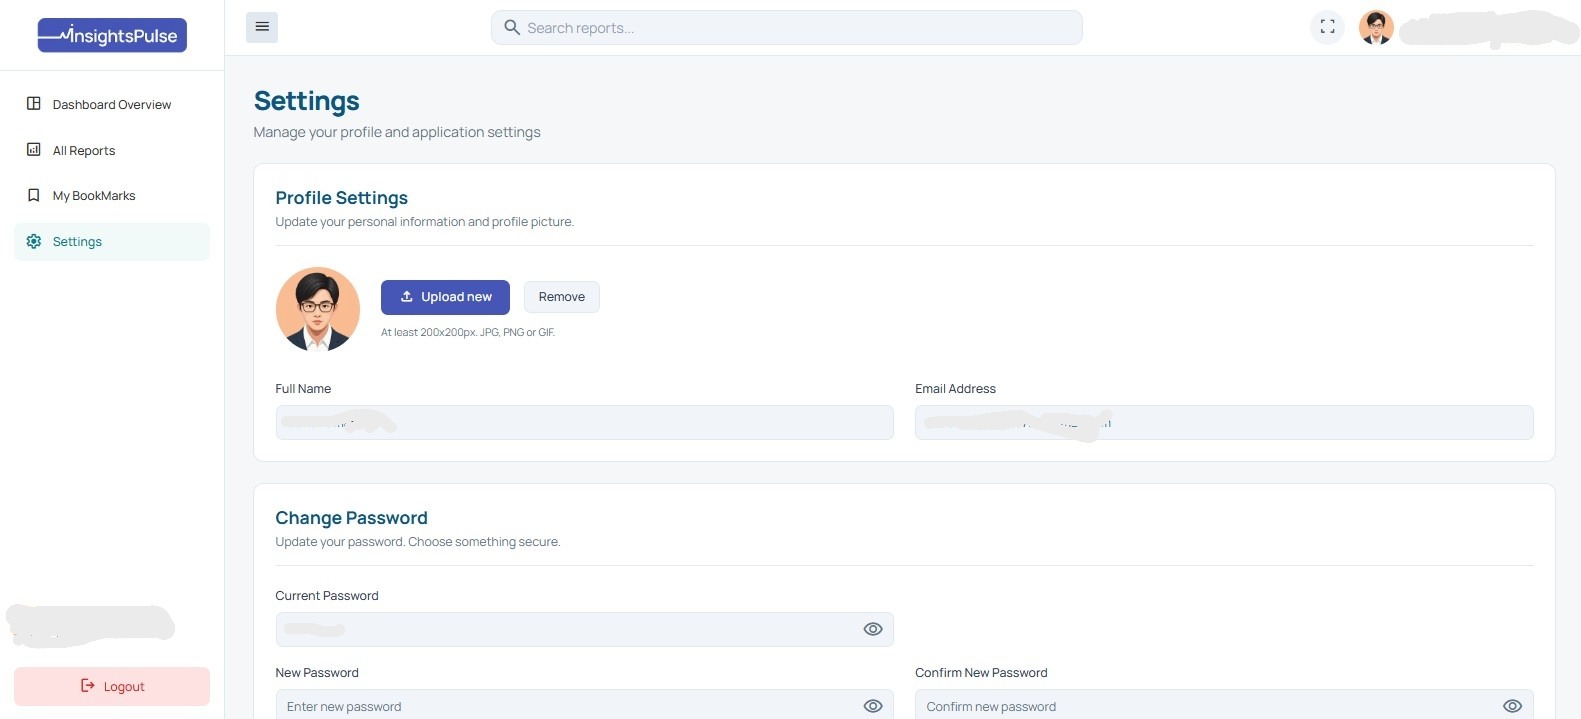
In the Settings module, administrators can update their personal information, modify security passwords, upload profile avatars, and navigate to theme configuration panels.
1. Profile Settings Panel
Manage outgoing profile details and personal identification details:
- Theme Settings Shortcut: Click the Theme Settings (dark_mode/light_mode icon) button at the top right of the dashboard page to toggle between Light and Dark mode globally across the application.
- Profile Avatar Management:
- Click Upload new to select a new image. The recommended resolution is at least 200x200px in JPG, PNG, or GIF format.
- Click Remove to delete the custom avatar image and reset to the default letter/placeholder avatar.
- Personal Identification Fields:
- Full Name: Edit your display name (e.g., Super Admin).
- Email Address: Update your primary contact and login email (e.g., [email protected]).
2. Change Password Panel (Security Credentials)
Update your login credentials securely inside the credentials panel:
- Current Password: Type in your active account password. Click the Eye Icon to reveal the hidden characters.
- New Password & Confirm: Type the desired secure password in the New Password field, and re-type it exactly in the Confirm New Password field. Use their respective eye icons to double-check spelling.
- Submit & Cancel Actions: Click Save Changes at the bottom right to apply new settings, or click Cancel to discard inputs.
16. Orders
The Orders module records subscription or plan orders raised for organizations. You can view all historical and active orders here.
- Order Details: View order ID, organization name, chosen plan details, and the total amount.
- Status Tracking: Check order status (Pending / Paid / Cancelled).
- Historical Traceability: Use this module to trace historical plan changes and verify active subscriptions.
17. Payments
Payments shows transaction-wise payment information for plans and renewals, allowing you to track revenue and pending transactions.
- Filters: Filter by date range, specific organization, or payment status.
- Troubleshooting: Quickly identify failed or pending payments and investigate reasons.
- Export: Download payment data for finance reconciliation.
18. Downtime
Downtime can be used to track or configure system maintenance windows or outages to ensure customers are informed.
- Maintenance Logging: Log planned maintenance periods in advance.
- Impact Analysis: Track impact on active organizations and report access.
- Support Reference: Use it as a reference for support queries regarding portal accessibility.
19. Settlements
The Settlements module summarizes how collected payments are settled to your primary bank account.
- Batch Details: View settlement batch ID, total amount, and processing date.
- Reconciliation: Match settlement records directly with your bank statements.
20. Instant Settlements
If enabled, Instant Settlements shows payouts that are settled instantly instead of following standard clearing cycles, ensuring immediate cash flow for specific transactions.
21. Refunds
Refunds captures any partial or full refunds issued to organizations due to cancellations or billing adjustments.
- Reference Tracking: View the original order and payment reference linked to the refund.
- Refund Details: Check the exact refund amount, reason, and processing status.
22. Disputes
Disputes can be used to log customer disputes around billing, access, or payment issues.
- Tracking: Track dispute reference, detailed description, and severity.
- Assignment: Assign an owner or team member to resolve the dispute.
- Resolution: Close the dispute with proper resolution comments and outcomes.
23. Account Object
An Account in InsightsPulse can represent your internal billing account configuration – for example, the entity used to collect and settle payments from client organizations.
- Details: Manage the account name and unique identifier.
- Payout Configuration: Setup bank and payout configuration if applicable.
- Organization Mapping: View associated organizations linked to this account.
24. Create an Account
To create a new billing account:
- Go to the Accounts section from the sidebar.
- Click the Create Account button.
- Fill in the account name, billing details, and payout configuration.
- Save the configuration and link organizations to this account, if required.
25. Update an Account
To modify an existing account:
- Open the Account Object list.
- Select the account you wish to edit and click the Edit (Pencil) icon.
- Update fields such as the contact person, bank details, or account status.
- Click Save to apply changes.
26. Delete an Account
Deleting an account should be done carefully, as it can impact billing and settlement mapping for linked organizations.
- Ensure no active organizations are currently mapped to the account.
- Navigate to the Account Object list.
- Select the account and choose the Delete (Trash) icon.
- Warning: A confirmation prompt will appear. Confirm the deletion when prompted to permanently remove the account.
27. Support
The Support section helps users raise issues, request assistance, and get in touch with the InsightsPulse support team. It ensures smooth usage of the admin panel and quick handling of queries.
When to Use Support
- When you are unable to access your dashboard or reports.
- If your organization, workspace, report or user is not visible.
- For subscription, billing or payment related issues.
- To report bugs, data mismatch or performance issues.
- When you need technical assistance for embedding reports.
How to Contact Support
You can reach support through multiple ways:
- Via the Support link available in the top header bar.
- By submitting a request through contact form on: InsightsPulse Contact Page
- Emailing the support team directly (if enabled).
- Help Widget: Look for the circular Blue Help Icon (?) located at the bottom right corner of the screen. Click it to open the support widget overlay to search for help articles, browse FAQs, or send a direct message.
Steps to Request Support
- Click on the Support button from the header.
- You will be redirected to the contact/support form.
- Enter your name, email, subject, and message.
- Choose the issue category (if available).
- Submit the request.
- You will receive a confirmation message after the ticket is logged.
What Information to Include
To speed up resolution, include accurate details:
- Your registered email ID
- Organization name
- Workspace name
- Report name (if issue is report-related)
- Screenshots (if possible)
- Error message (if any)
- Brief description of the problem
Support Response Time
- General Queries – within 24 hours
- Technical Issues – within 24–48 hours
- Critical Issues (login failure, report not loading) – fastest possible response
Tips Before Contacting Support
- Try logging out and logging in again.
- Clear browser cache and reload the page.
- Check whether your plan or subscription is active.
- Refresh the report list after changing workspace/category.
Example: Sample User & Report Mapping (JSON)
Sample Configuration (for reference only)
                                            {
                                            "user": {
                                            "id": "USR-1001",
                                            "name": "Demo User",
                                            "email": "[email protected]",
                                            "organizationId": "ORG-01",
                                            "role": "Viewer"
                                            },
                                            "workspaces": [
                                            {
                                            "id": "WS-01",
                                            "name": "Sales Analytics",
                                            "reports": [
                                            {
                                            "id": "RPT-001",
                                            "name": "Monthly Sales Overview",
                                            "category": "Sales",
                                            "isAllotted": true
                                            },
                                            {
                                            "id": "RPT-002",
                                            "name": "Region-wise Performance",
                                            "category": "Sales",
                                            "isAllotted": true
                                            }
                                            ]
                                            }
                                            ]
                                            }